The Digester DAQ and control system
After completing work on the electrical system so that manual control was possible without flipping circuit breakers, the automation part could begin. I chose to use modules from SixNet, as they have a very nice package of open-source based PLC equipment. This system was designed to use an MIPM and RemoteTrak RS-485 digital and analog i/o modules.
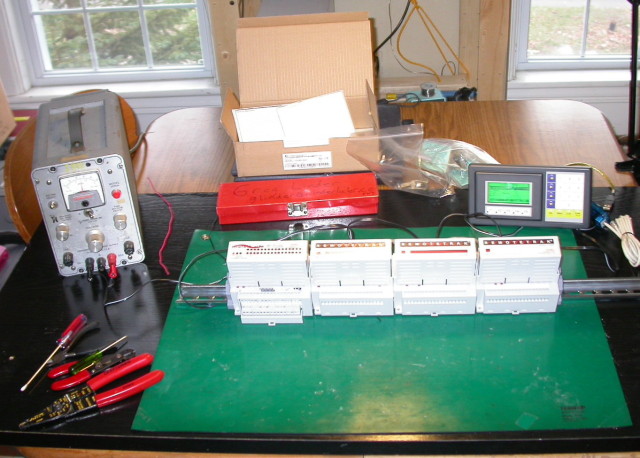 This is the control system as it was initially set up on my kitchen table. The purpose of this was to get the HMI to talk with the PLC and begin to program it to allow the HMI to read stuff out and the operator to control things via the HMI. Next step would be to use our experience to program up semi-automatic operation. Unfortunately, due to the accelerated schedule, it was decided that the PLC should be installed ASAP as a DAQ. Originally, most of this hardware was to be mounted inside a LV cabinet, which would have been mounted immediately next to the line voltage cabinet described in the page on the electrical system. The addition of the HMI and nice features had to be postponed on account of time limitations.
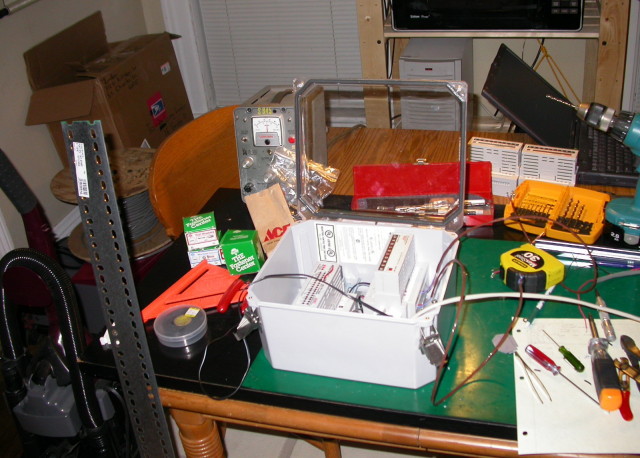 As a stopgap measure, given that the whole system could not be installed in time, I took the PLC and one of its analog input modules and installed it in a weather tight box. The SixNet I/O toolkit makes this type of DAQ design a breeze. Compared to the other hardware available on the market, the SixNet gear is cheap and easily configurable. It turns out that the DAQ market tends to cater toward insanely high speeds or really cheap. Very few people at this point, save for the industrial controls people, make robust and affordable low-speed high reliability data gathering gear.
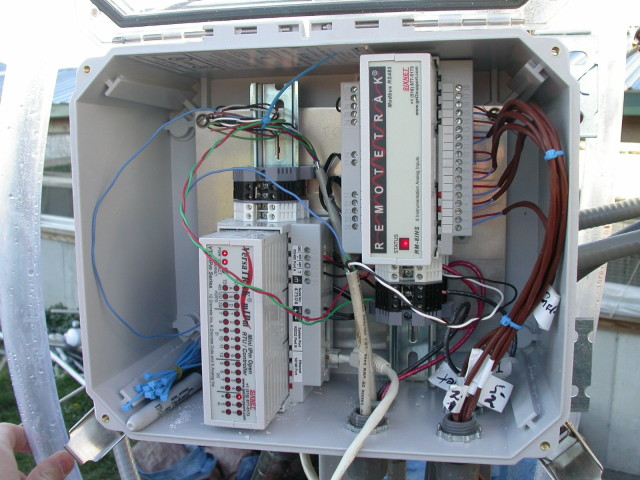 The DAQ system installed in its box on the digester. The right module is reading eight thermocouples spaced around the tank and heater system, The left module is the PLC itself, which also has analog 4-20 mA inputs for reading the methane sensor, and a pulse input which is reading the gas meter for our volumetric flow indication. The gas meter outputs one pulse per two cubic feet, and the PLC counts these pulses. It's possible to look at the data then and withdraw approximate hourly flow rates based on the PLC's timestamps. This was more appropriate for our application than a full-time mass flow meter.
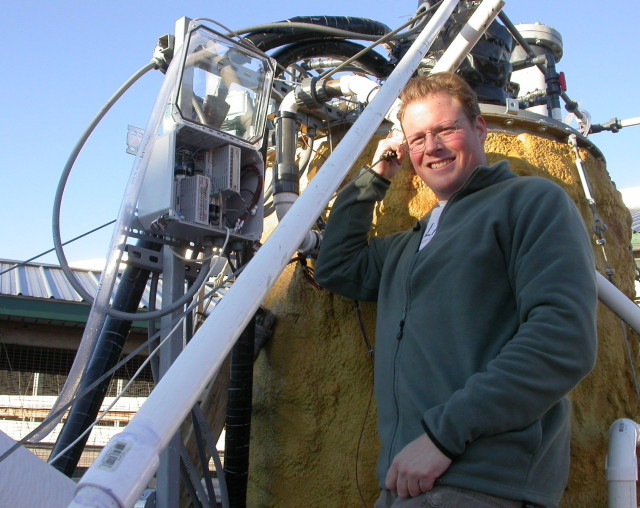 Me standing next to the the DAQ as installed. Behind me you can see the weir, also called a gooseneck, which regulates the tank fluid height and therefore the pressure. The jacketed black pipes are the heater loop. I chose to enclose all the PLC equipment in transparent covered boxes, as it looks cool but it also allows for easy examination of the system's status LEDs. The pipe going down the center of the frame carries biogas to the back pressure regulator.
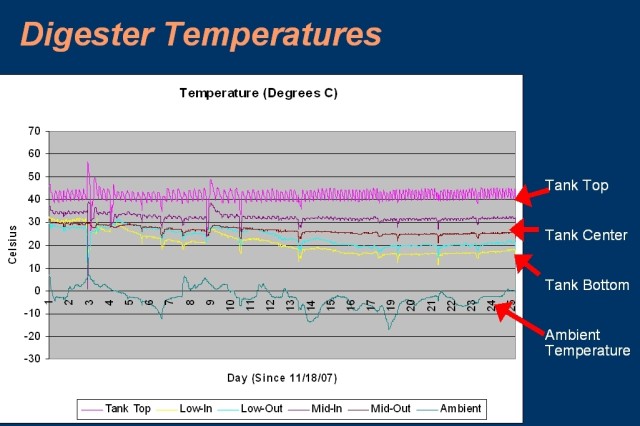 Here is an example graph from the DAQ system showing our daily tank temperature variation. The ambient temperature is on the bottom line. The data is logged at ten minute intervals, which offers enough resolution to make the heater pump duty cycle readily apparent. The frequency of the hot/cold oscillations increases noticeably as the ambient temperature drops. Also apparent are the immediate temperature drops that came from the manual feeding operation.

